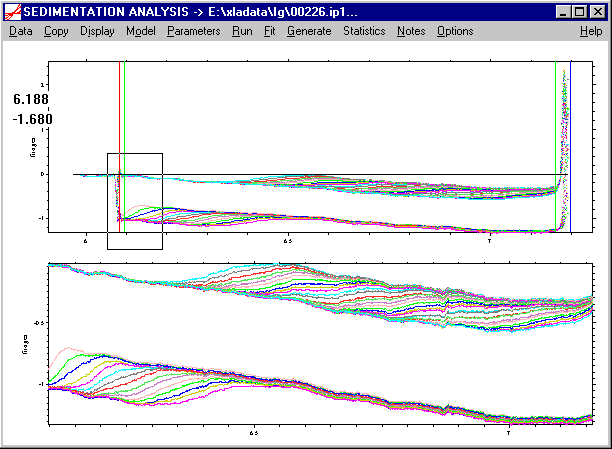
The easiest way to change the data plot is to
Zoom and Unzoom with the Right Mouse Button
This can be done by pressing the right mouse button while spanning a rectangle that describes the region of interest, like this:

After releasing the right mouse button, the region in the rectangle will be the display range. In order to get back to the previous display window, just double-click with the right mouse button. Internally, Sedfit keeps track of the 10 last display ranges, and double-clicking with the right mouse button gets one back sequentially. The last range is always the full-scale.
New in version 8.5 and higher: The zoom operation and double click operations should be done in the range of the data graphics. When a size-distribution plot is displayed, a similar functionality exists for zooming in and out of the distribution plot, if the mouse operations are applied to the area of the distribution plot.
Display | Set Range
Display | Full Range
Display | Data Range (keyboard shortcut ctrl-
D)As an alternative to the mouse input, the plot range of the data graphics can be changed by numerical input of the minimum and maximum radius and signal, respectively. Double click with the right mouse button changes back to the last display range.
Full data range can be achieved using the menu function.
For convenience, the displayed range can also be adjusted to include only the data within the fitting limits. This is done with the function ‘data range’, which can also be invoked by the keyboard shortcut Ctrl-D.
Display | Data Mark Size
Since the display of a large number of data points contained in the sequence of sedimentation velocity scans can be problematic and time-consuming, this function allows to optimize the data mark size for the screen that is being used. This may help inspection of the quality of the fit.
The default size for absorbance data are circles with 2 pixel radius, whereas for interference data it is a single pixel per data point.
These settings can be changed to single screen pixels (values 0 or 1), or to larger circles. The entry -1 changes the presentation of the data from points to lines for each data set.
If working with interference data, changing the data representation to lines may accelerate the drawing of the data to the screen.