Aqueous versus organic solvents
Shapes of macromolecular sedimentation profiles in compressible solvents
The pressure and density distribution across the solution column
Finite element solutions of the Lamm equation with solvent compressibility
Analytical solutions for sedimentation of non-diffusing particles in a compressible solvent
Sedimentation coefficient distributions in compressible solvents
At the centrifugal fields obtained at high rotor speed, pressure builds up > 30 MPa, and the compressibility of the solvent is large enough to generate density gradients along the solution column. According to tables from Svedberg's book (1), the density changes can be > 1%. Although this appears small, the effects are amplified as changes in the buoyancy of the sedimenting macromolecules.
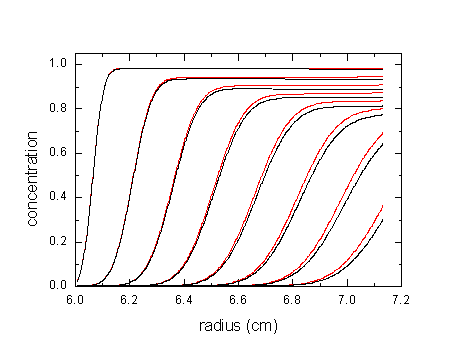
How large are these effects? That depends on the solvent, macromolecule, rotor speed, solution column length, etc., but here are some examples:
The red lines a 50 kDa protein (v-bar 0.73 ml/g) sedimenting at 60,000 rpm. Black are the distributions neglecting the compressibility of water (for details see ref 2).

This effect may not seem a lot, but considering the precision that we usually get from the experimental data and from modeling, this is highly significant. In terms of errors in the sedimentation coefficient or in molar mass values, the following shows the effects of ignoring compressibility of water (12 mm column, 60,000 rpm, see 2):
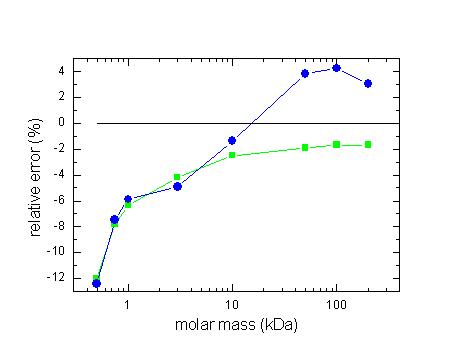 (errors in s: squares,
errors in M circles)
Generally, for proteins at high rotor speeds we have a few percent error. However, it can be significantly larger if back-diffusion is a significant part of the sedimentation process, because that involves the regions that are more compressed. (The transition whether the error in M results in an over- or underestimate depends on the extent of backdiffusion.)
It's true we can minimize the effect by going to lower solution column, but we'd have to reduce it a lot to really eliminate the problem:
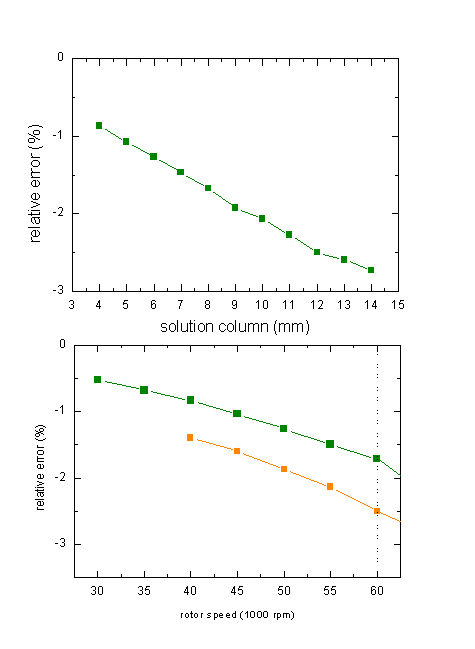 (top: relative error
in s for a 10 kDa protein at 60,000 rpm; bottom: relative errors in s for a 10
kDa and 100 kDa protein with a 12 mm column)
Likewise, obviously the compression increases with higher rotor speed, but again we'd have to sacrifice a lot of resolution by going to rotor speeds low enough to really make a difference.
The detailed effects naturally will depend on the specific data set analyzed, but the errors can be very relevant, for example, when comparing the experimental s-value with theoretical ones predicted from structure. They can be much larger for proteins that have a density closer to solution density (i.e., higher v-bar, buffers with higher density for example those with D2O, etc.).
Organic solvents are commonly known to be more compressible than water. For example, the density of toluene at the base of a 12 mm column spinning at 60,000 rpm is higher by 2.5% than at the meniscus. For polystyrene in toluene, this translates to a change in buoyancy of ~ 10% - quite significant! If you want to reduce the analysis to boundaries close to the midpoint of the cell, it's still an error of 5%. Mosimann & Signer have even described a 28% change in buoyancy across the solution column for nitrocellulose in acetone (4). Although the latter system may appear obscure for modern protein scientist, the effects are substantial enough to serve as a reminder for keeping compressibility in mind.
It is a common belief that compressibility is an important issue for organic solvents, but not for aqueous. I think this is a myth, perhaps conveniently avoiding the computational challenges of taking solvent compressibility into account: The numerical value of the compressibility coefficient for water is 4.59 x 10⁻⁴/MPa, while that for toluene is 8.94 x 10⁻⁴/MPa - that's only a factor of ~ 2 difference, and it's only a factor of ~ 3-4 for the most compressible organic solvents! Obviously, this is not a qualitative difference.
Already Svedberg 1940 in his book (1) has recognized the solvent compressibility to be a significant factor in the precise determination of sedimentation coefficients. He recommended corrections to be always applied for organic solvents, but for water only at higher rotor speeds and longer solution columns. As mentioned above, Mosimann & Signer (1944) have described significant compressibility effects (4). In 1954, Schachman has published a study on pressure effects (10), and later in his book (1959) he noted that the large gains in experimental precision at the time will make pressure corrections more important (5). For isopycnic density gradient sedimentation, water compressibility has been shown to be significant and was routinely considered by Vinograd et al. in 1962 (6).
On the theoretical side, Oth and Desreux have described in 1954 an approximate correction of compressibility through an extrapolation procedure to zero pressure (7). Fujita has thought about this problem, deriving in 1956 an approximate description of the effect of hydrostatic pressure on the concentration distribution of non-diffusing particles (8) (see below), noting later in his book that the extrapolation of Oth and Desreux was probably difficult to use with experimental data (9).
After this period, I found very little published on this topic. This appears a bit strange, as many theoretical and practical studies on ultracentrifugation methodology have been published later (including topics that may appear nowadays rather obscure). Possible reasons for this neglect could perhaps be the lack of progress without the benefit of modern computation, and/or the judgment that estimated errors in aqueous solutions would be tolerable. The latter should be reconsidered, however, given the precision that we currently achieve experimentally, and the improvement of the analytical procedures.
Shapes of macromolecular sedimentation profiles in compressible solvents
The increasing density of the solvent towards the bottom of the cell causes a continuous increase of buoyancy and reduction of the sedimenting force. On the propagation of the boundary, this is the effect of a deceleration:
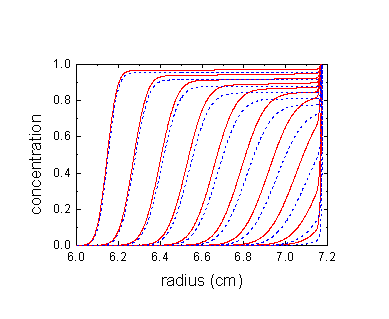
shown here in red are the sedimentation profiles of polystyrene in toluene, for comparison in dashed blue are the calculated profiles without compressibility. It is very clear how the red boundaries propagate slower and lag behind the dashed blue ones. This feature is similar for the example of proteins in water shown above. The effect is less closer to the meniscus and stronger closer to the bottom.
A second feature of compressibility effects is a steepening of the boundaries. (This can cause the molar mass estimates to be too large - or diffusion coefficient estimates to be too small.) Slower sedimentation at higher radii causes the reduction of the boundary spreading.
Also note that the plateau concentrations are much higher than without compressibility. Normally, the square dilution rule with sector-shaped centerpieces causes the flux into any volume element in the plateau region from the left to be equal to the flux out of the volume element to the right. Because of the radial-dependent buoyancy, this is not the case in compressible media. The macromolecules sediment slower at higher radii, i.e. generating a smaller flux out of a volume element of the plateau than the flux into the volume element. As a result, there is less pelleting of the material at the bottom, and instead the macromolecule piles up continuously in the 'plateau' region. This is illustrated here (again for polystyrene in toluol):
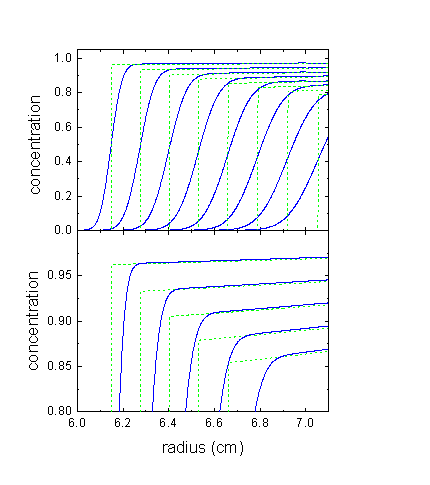
The lower plot is a magnified view of the 'plateau' regions, and shows how they slope upwards because of the decelerated sedimentation. The dashed green lines are the theoretical analytical profiles for non-diffusing particles, as derived below.
The same effect also causes the equilibrium (and approach to equilibrium) profiles to be less steep than what they would be in incompressible media. The following is the equilibrium profile of a 2 kDa peptide in aqueous buffer at 60,000 rpm: blue solid line is the expected profile in water (compressible!), the red dotted line is the steeper profile for an incompressible medium.
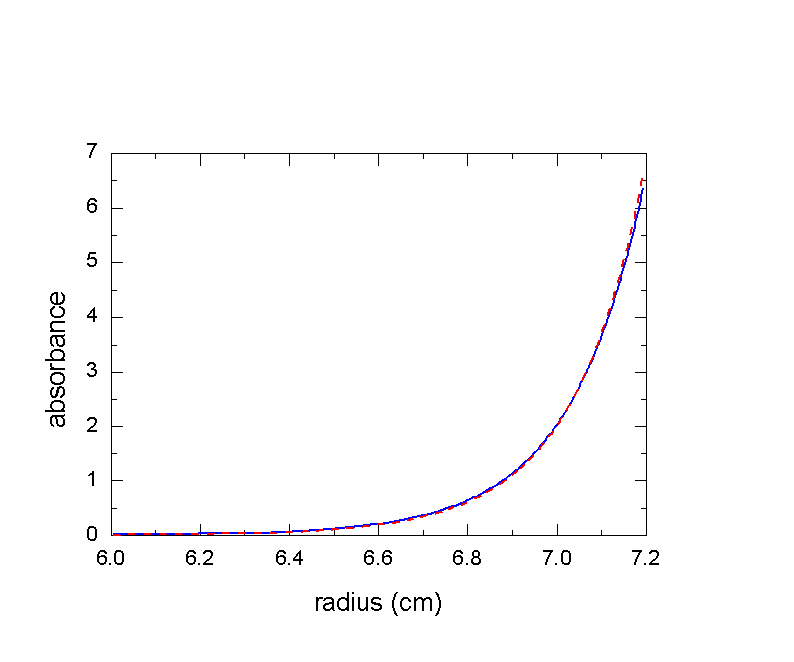
Neglect of compressibility would here give a 4% too low molar mass value, or alternatively, if the molar mass was known from sequence or mass spec, maybe we would wrongly conclude that the partial-specific volume was 0.745 ml/g instead the true value of 0.730 ml/g.
The pressure and density distribution across the solution column
There are different levels of approximation to describe the pressure and density distribution. The simplest description starts with calculating the pressure at any point in the solution column as
(Eq. 1)
![]()
(with pressure p, solvent density r0, rotor speed w, radius r and meniscus m). After that, we consider that the solvent is compressible and its density changes with pressure according to
(Eq. 2)
![]()
(with solvent density r, standard density r0, and compressibility k). Taken together, we get the radial-dependent density as
(Eq. 3)
![]()
This is a pretty good approximation for common solvents. The problem with that is, of course, that the first equation for the pressure assumed the solvent density to be constant, whereas the result in the end tells us that it's changing with radius (which we know is true). However, it is correct in the limit of low compressibility, because the density doesn't change that much to completely invalidate our pressure estimate in Eq. 1. For example, for toluene it underestimates the solvent density at the bottom of the cell by ~ 2.5% -- and we're talking about a 2.5% error in the description of something that itself leads only to a few percent change in s and D - that's not bad at all, and we'll make use of that later on.
A theoretically more satisfying description of the density and pressure distribution can be arrived at by coupling the two from the outset: The differential change in density with a small increase in pressure is
(Eq. 4)
![]()
and, in turn, the differential change in pressure with radius is given by the local weight of the solution column as
(Eq. 5)
![]()
With the boundary condition that the solvent density at the meniscus is the standard density r0, we can solve this coupled set of differential equations and get
(Eq. 6)

This expression looks different but is numerically similar to Eq. 98 in the Schachman book (5), which was derived with Eq. 2 instead of the differential Eq. 4, generating differences only from the third Taylor term on. However, it is quite different from the more complicated expression given by Fujita 1956 (9), which I believe contains some error, maybe a typo or something; I just could not verify Fujita's expression (even with automatic symbolic math software).
Finite element solutions of the Lamm equation with solvent compressibility
In order to describe the sedimentation of a macromolecule in an inhomogeneous solvent, we can use the Lamm equation
(Eq.
7) ![]()
but have to consider that the sedimentation and diffusion coefficients are not constant, but change locally due to the local solvent density. In general, this requires local corrections for solvent viscosity
(Eq.
8)
![]()
(with normal viscosity h20,w, local viscosity h(r,t)) and for solvent density
(Eq.
9)

(with normal solvent density r20,w, local density r(r,t), normal partial-specific volume v-bar and apparent partial-specific volume F'). The corrections can be conveniently expressed with the factors a and b. Constants are the diffusion coefficient D20,w and the sedimentation coefficient s20,w under normal conditions. The problem of Eq. 7-9 is solved in a general way in ref 3. The strategy used takes the finite element Lamm equation method described in the Lamm equation tutorial, but extends it to expand the factors a and b also in terms of combination of elements Pk(r,t)
(Eq.
10)

The problem at hand with solvent compressibility is simpler than in the general case, because the viscosity is treated as being constant, because the density is not time-dependent, and because we do not consider solvation to be significantly different from standard conditions. (This is not true, for example, for self-forming density gradients, see the dynamic density gradient tutorial. We also ignore here the issue of pressure effects on proteins (11), their solvation, conformation, or interactions.)
The additional terms from the expansion Eq. 10 cause the matrix elements A(1) and A(2) to become sums over tensor elements
(Eq.
11a)
![]()
(Eq.
11b)
![]()
, which leads us to the new matrices A(1*) and A(2*). Analytical expressions for the tensors are derived in ref 3. We can see, though, that for time-independent solvent properties such as the density gradients caused by compressibility, we have to make the summation over the tensors Eq. 11 only once, therefore not causing any noticeable increase in computation time compared to 'ideal' sedimentation. These replacements entirely encode the specifics of the solvent and the new local sedimentation and diffusion fluxes.
Throughout the this treatment, we assumed that the compressibility of the macromolecules of interest is negligible compared to the solvent. For globular proteins, this is a good approximation, as folded proteins have ordinarily compressibilities only about 10-20% of that of water (11).
Analytical solutions for sedimentation of non-diffusing particles in a compressible solvent
It can be very useful to have analytical expressions for the concentration profiles of non-diffusing particles. They are a good model for very large particles, such as large protein complexes or dispersions in synthetic macromolecular chemistry. They can also serve as useful models in the apparent sedimentation coefficient distribution ls-g*(s). Finally, they can independently validate the results from the finite element solutions of the Lamm equation.
A non-diffusing particle sediments according to the equation
(Eq.
12)
![]()
which can be integrated assuming that it was initially at the meniscus, resulting in the well-known expression
(Eq.
13)
![]()
which describes the movement of the sedimentation boundary of an ensemble of non-diffusing particles. The corresponding expression for the plateau concentration is the well-known radially constant plateau
(Eq.
14)
![]()
Although Eq. 12-14 are not valid in compressible media, they point the way for how to solve the problem in compressible solvents, since we can try to look for appropriate substitute expressions.
We start with the equation of motion in a density gradient
(Eq.
15)
![]()
which looks like Eq. 12, but reflects the local changes in the sedimentation rate due to the changing buoyancy (there's no viscosity effect considered). Like Eq. 13, this can be integrated, if we make use of the simple density distribution of Eq. 3
![]()
(this leads to a differential equation of the type y' = ay + by3, which can be analytically solved). A particle initially at a radius r0 will later be at the radius R
(Eq.
16)

![]()
![]()
(apologies for the typo in the preprint). If we insert r0 = m, then we get the boundary position at time t, i.e. a direct replacement of Eq. 13. In fact, Eq. 16 contains the well-known Eq. 13 as a special case for k = 0.
This is the boundary position, but how can we get to the 'plateau' shape? The trick is to utilize a form of mass conservation. Since we formulated Eq. 16 in a more general way, not constraining the initial position of the particle to be at the meniscus, we can also calculate where particles end up that were initially somewhere else in the solution. For example, we can consider what happens to the particles at the radii r0 and r1:
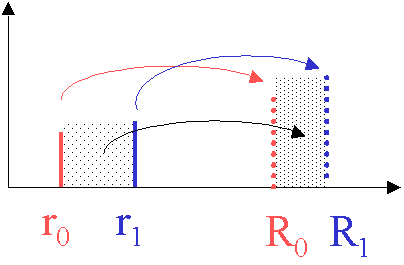
they move to positions R0 and R1 at a later time. Since the propagation from r to R is a monotonous function (which means no particle can pass another one, because there's no diffusion), all the stuff between r0 and r1 will also end up later between R0 and R1.
Let's do the mass balance for the stuff between the two radii: initially we have
(Eq.
17)

(with c(r,0) the initial concentration distribution, which we could assume constant) and later we have
(Eq.
18)

Mass balance requires that M = M*. How does this solve the problem? After all, we know only the integration limits but not c(r,t)?? If we write the rhs of Eq. 17 and 18 differently, by making r1 only slightly larger than r0 (r1 = r0 + Dr) we have
(Eq.
19)

(where we made use of our knowledge of Eq. 13, R0 = R(r0,t) and R1= R(r0+Dr,t)). From here, division by Dr and going to the infinitesimal limit for both sides permits the application of the calculus formula
(Eq.
20)
![]()
(in our case, on the lhs f(r) is rc(r,0) and g(Dr) is r0+Dr, and on the rhs f(r) is rc(r,t) and g(Dr) is R(r0+Dr,t)), leading to
(Eq.
21)
![]()
or rearranged, we have the shape of the 'plateau', given the propagation law R(r,t)
(Eq.
22)

This equation is quite general, and already contains the square dilution law for sector shaped cells.
The basic idea here is that mass conservation can couple our propagation law to the density distribution. The key observation is, as illustrated above, that anything initially within a small volume element will stay in the same volume element after we propagate it's boundaries. Therefore, if we know how the boundaries move and if we know the initial distribution, we can predict the shape of the distribution at any later time. This is simply because we know how the stuff gets diluted and stretched or how it piles up because the particles slow down and squeeze together. (Another analogy would be to make two marks on a piece of rubber and then stretch it - you would be able to readily tell the decrease of the mass per unit length simply by telling how far the marks have moved apart.)
For the propagation Eq. 16 in the density gradient from compressible solvents, assuming homogeneous loading, we get the following plateau shape:
(Eq.
23)

The only remaining difficulty in Eq. 23 is that it specifies the shape of the 'plateau' in an odd way - the left hand side is an implicit function, which means we know how the distribution changes shape during the propagation, but we also have to calculate separately where the particles are located at a given time. That poses no computational difficulty, however, since we can simply have the computer make a map of where particles from a given initial radii (e.g. equidistant spaced throughout the solution column) end up with Eq. 16, and then evaluate Eq. 23 for what the plateau concentration is at those particular radii. (In other words, we just can't ask directly 'what is the concentration at this particular radius r at the time t', but have to observe 'a particle initially at r0 will end up at R(r0,t), and at that time, the local concentration is as given by the right-hand side of Eq. 23'.)
In this way we have arrived at the analytical solutions of the Lamm equation for non-diffusing particles in a compressible solvent. The solution is approximate in a sense that it is valid in the limit of low compressibility (due to the use of Eq. 3), but this is a very good approximation for common solvents. I have tested this solution to be numerically consistent with the finite element Lamm equation solutions in the limit of very small D (2).
Sedimentation coefficient distributions in compressible solvents
As we have seen above, it is possible to adjust the finite element solutions of the Lamm equation to sedimentation in compressible media without noticeable loss of performance. Therefore, they can be used just as the finite element Lamm equation solutions in incompressible media as kernels for sedimentation coefficient distributions c(s) and c(M). Calculating c(s) and c(M) poses no further difficulty, and you can refer to the tutorial on sedimentation coefficient distributions.
Note that in the compressible solvent mode, the entries for v-bar, density and viscosity in the parameter box are under normal conditions.
It is interesting to see what are the errors in the distributions if we neglect compressibility: The following example shows c(s) and c(M) distributions based on simulated data of a 100 kDa polystyrene in toluene (s = 0.8 S, 12mm column, 60,000 rpm)
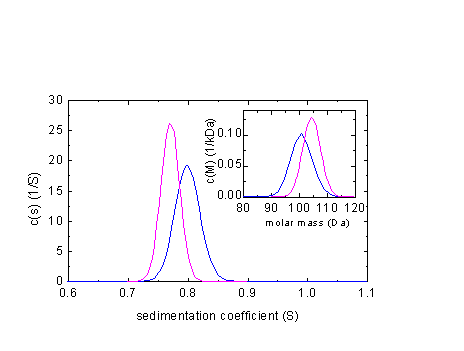
In blue is the correct distribution, in magenta the one arrived at when ignoring compressibility. A similar calculation for a 100 kDa protein in PBS (s = 5 S, 12 mm column, 60,000 rpm) gives the following results:
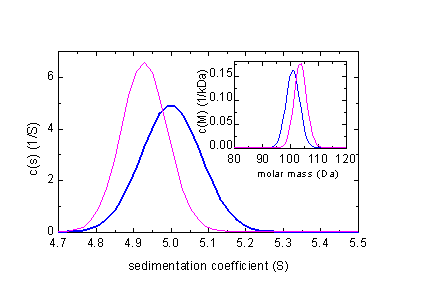
The errors from ignoring compressibility of water are not as large as in toluene, but still quite significant.
As mentioned above, our analytical solutions for non-diffusing particles can be used without further complications to calculate ls-g*(s) distributions that take into account solvent compressibility. For the example above of an 0.8 S polystyrene sample in toluene, we can compare the result of ls-g*(s) with solvent compressibility (blue) with g*(s) (magenta), or the van Holde-Weischet results (red, scaled).
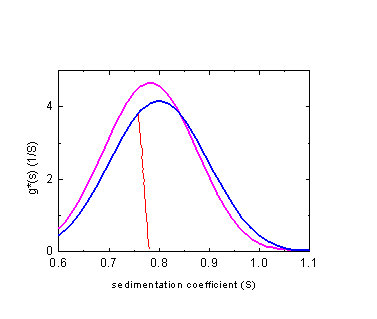
Note that for all sedimentation coefficient distributions in the inhomogeneous solvent mode, the s-values will be transformed to standard conditions.
References
(1) T. Svedberg and K.O. Pedersen (1940) Die Ultrazentrifuge. Theodor Steinkopff, Dresden.
(2) P. Schuck (2003) A model for sedimentation in inhomogeneous media. II. Compressibility of aqueous and organic solvents. Biophysical Chemistry 108:187-200
(3) P. Schuck (2003) A model for sedimentation in inhomogeneous media. I. Dynamic density gradients from sedimenting co-solutes. Biophysical Chemistry 108:201-214
(4) H. Mosimann and R. Signer (1944) Helv. Chim. Acta 27:1123
(5) H.K. Schachman (1959) Ultracentrifugation in Biochemistry. Academic Press, New York.
(6) J. Vinograd and J.E. Hearst (1962) Equilibrium sedimentation of macromolecules and viruses in a density gradient. Fortschritte der Chemie organischer Naturstoffe 20:373-422.
(7) J. Oth and V. Desreux. (1954) Bull. Soc. Chim. Belges 63:133
(8) H. Fujita (1962) Mathematical theory of sedimentation analysis. Academic Press, New York.
(9) H. Fujita (1956) J. Am. Chem. Soc 63:1092
(10) P.Y. Cheng and H.K. Schachman (1954) The effect of pressure on sedimentation and compressibility measurements in the ultracentrifuge. J. Am. Chem. Soc. 77:1498-1501
(11) B. Gavish, E. Gratton, C.J. Hardy (1983) Adiabatic compressibility of globular proteins. PNAS 80:750-754