Data from the analytical ultracentrifuge can have two kinds of systematic signal offsets: 1) a background profile that changes with radius but is common to all scans, which is referred to as time-invariant (TI noise) (possible sources are dust or scratches on the window in absorbance optics, or the systematic optical pathlength variations due to imperfections in some of the optical components of the interference optics); 2) a radially constant offset which can change in each scan (referred to as radial invariant, or RI, noise), such as the integral fringe shift and 'jitter' commonly encountered in interference optical data.
It has been shown that pseudo-absorbance data (generated without reference sector from intensity scans, thereby allowing to perform two separate sedimentation experiments in each cell) can also be described by including these systematic signal offsets (ref 4).
Traditionally, RI noise has been corrected for by 'alignment' of the scans over a range of radial values (for example, in the air-to-air region of the cell), and TI noise was eliminated by analyzing pairwise differences of scans (for example, in the dc/dt transformation or in the Dc approach). Although these approaches are suitable for many cases, sometimes they are not optimal because the alignment over a limited radial interval may not completely eliminate RI noise, the pairwise scan subtraction slightly increases the statistical noise, or because they do not allow to inspect directly the raw data versus model data.
Therefore, Sedfit uses an algebraic noise decomposition strategy (described in Ref 1) that is completely based on direct least-squares modeling of the sedimentation data of interest. No increase in the statistical noise is produced, and importantly, explicit estimates for the magnitude of the systematic noise components are obtained. The best-fit time-invariant noise component of the data is shown as a black line in the data plot. Also, the estimate of the systematic noise contributions allows to subtract the systematic noise from the data for a detailed inspection of the data and the fit (see the menu Display-> subtract all systematic noise from raw data).
In the following, two derivations for the algebraic systematic noise decomposition are introduced. First, a very general mathematical approach is described which is based on simple linear least squares. Less mathematically inclined readers can jump immediately to a more intuitive illustration of the result from the mathematical treatment. Finally, examples are given of the noise decomposition for interference and absorbance data.
The step-by-step tutorial includes the treatment of systematic noise in interference data, as well as the example of using Sedfit. In general, for using this approach, only the TI and RI noise fields need to be checked in the parameter box (which is the default for analyzing interference data.)
Mathematical Approach for Systematic Noise Analysis
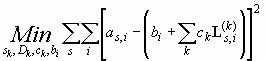
First, we consider the least-squares problem of modeling the data points as,i from a set of scans with radial points ri taken at times ts (using the shortcut as,i for a(ri,ts)). To show the principle, we assume that we want to fit the data with k independent solutions of the Lamm equation L(k), each with a loading concentration ck , and we denote the calculated local concentrations as L(k)s,i (at any time ts and radial points ri ). Of course, each of the Lamm equation solutions has parameters, here just assumed to be sedimentation coefficients sk and diffusion coefficients Dk. None of the specifics of the sedimentation model matters in the following treatment, and completely analogous derivations can be made for other models. Important is only the systematic noise, which we constrain at first to be time-invariant (TI) noise. Because TI noise has an unknown value at each radius, but is common to each scan, we can denote it in general as bi (with the index i for the different radius values).
According to the principle of least-squares modeling, we want to find the minimum of the squared difference between the data points and the model, summed over all data points (i.e. all radial indices i and all scans s). The parameters to be optimized are those of the Lamm equation models (sk, Dk), the partial concentration of each Lamm equation model (ck), and all the TI noise bi at each radial point:
(Eq. 1)
The key to solving Eq. 1 efficiently is to divide the problem up it into separate minimization problems for the nonlinear parameters and for each of the linear parameters (Ref 3). It will be seen that the linear parameters can be directly solved, if we assume any particular value for the nonlinear parameters. Because the linear parameters are so easy and fast to calculate (as will be seen), we can afford to reevaluate them each time when we test any set of the nonlinear parameters. It is shown in the next paragraphs how we can eliminate the linear parameters, leaving an ordinary non-linear least-squares problem with a reduced number of parameters, and importantly, without any systematic noise parameters.
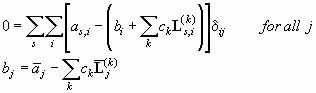
As in elementary calculus, the minimum of a function is characterized by a vanishing derivative. Applying this principle to the double sum of Eq. 1, we can set the partial derivative of the sums in Eq. 1 with respect to any particular parameter bj equal to zero. Since the baseline parameters are uncorrelated, (dbi/dbj) = dij (with the Kronecker symbol dij meaning 1 for i = j, and 0 else), and we get an equation system
(Eq. 2)
(note that the
square has disappeared when taking the derivative, and that we have divided the
equation by 2). The second equation is obtained by executing the summation,
using the abbreviations ![]() (with the total number
of scans ns) and
(with the total number
of scans ns) and ![]() . It can
be seen that
. It can
be seen that ![]() corresponds to the average signal at
a radial point rj (averaged over all scans) and
corresponds to the average signal at
a radial point rj (averaged over all scans) and ![]() is the same average for each Lamm equation solution. We can insert the result of
Eq. 2 (after renaming our running variable from j to i) into the
original minimization problem (Eq. 1) and get a simpler problem
is the same average for each Lamm equation solution. We can insert the result of
Eq. 2 (after renaming our running variable from j to i) into the
original minimization problem (Eq. 1) and get a simpler problem
(Eq. 3) 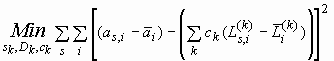
which does not contain any of the original noise parameters.
In fact, we can apply the same strategy to all linear parameters including the Lamm equation loading concentrations ck: taking the partial derivative with respect to any of the concentrations, lets say cl gives an equation system
(Eq. 4)

This equation can be directly solved by matrix algebra. This is very similar to the size-distribution calculation, where the parameters of the entire distribution are linear (this is further developed in the tutorial on size-distribution analysis).
! Instead of the standard algebra routines for linear equations, we can make sure that we do not get negative concentration values by using the algorithm NNLS from Lawson and Hanson, Ref 2, which we have modified for use with normal equations.
At this point, we have formally calculated all our linear parameters, but their numerical value still depends on the particular set of nonlinear parameters, i.e. on the Lamm equation solutions in our sedimentation model. We can write the remaining problem of minimizing those nonlinear parameters as
(Eq. 5)

with the abbreviation
![]()
What this means is that we optimize the non-linear parameters (sk, Dk), and for each evaluation of our boundary model L* we recalculate all the linear parameters. It also becomes clear here that the calculated systematic noise components are not absolute quantities, but also best-fit estimates for the systematic noise in conjunction with a particular boundary model.
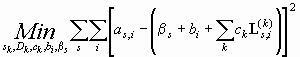
What about RI noise? Initially, the problem of modeling the boundary with both TI noise and RI noise appears more complex, but the problem can be reduced to the case of TI noise only. If we denote the baseline offset of each scan as bs, we can include an additional term in Eq. 1:
(Eq. 6)
There is a slight complication because the bs and the bi are not independent: imagine adding a value of 1 to all bs and subtracting 1 from all bi - this does not change the sum in Eq. 6. Therefore, we have to introduce a constraint, which can be most conveniently done by requiring the TI noise to have an average of zero.
Like before, we can set the partial derivative of the sum in Eq. 6 with respect to bs zero in order to find the minimum. The sum over the scans disappears, since only one term will be dependent on any particular bs , and because it is independent of radius, we can pull bs out of the summation as product of the number of radial points (nr) and bs . The remaining equation, when solved for bs looks like:
(Eq. 7)
In the lower equation, we have introduced an abbreviation for the 'scan-average' (i.e. summation over all radial points and division by the number of radial points) for the data and for each of the Lamm equation solutions. If we insert this result into Eq. 6, we obtain
(Eq. 8)
which is identical to Eq. 1 for TI noise only, except that we have substituted the data and the boundary model by difference between the data and its 'scan-average'. Because Eq. 8 is formally equivalent to Eq. 1, we can solve it in the same way.
It should be noted that the boundary parameters can be optimized either in the original data space, such as indicated in Eq. 5, or in a difference expression, such as the time-difference in Eq. 3 (where the reference for calculating the time-difference is an 'average scan') or a 'scan-difference' in Eq. 8. Both ways are mathematically equivalent. In some cases, e.g. in the size-distribution analysis, the difference expressions are much easier to handle in subsequent calculations (i.e. normal equations and regularization). These difference expressions capture the entire available information on the sedimentation. Explicit calculations of the systematic noise parameters can be done using Eq. 7 and 2 after all the sedimentation parameters are optimized.
If we look at just the problem of TI noise and simplify the notation, we can say that we consider our measured data A as a result of some sedimentation process, described by a boundary model L, superimposed by a time-invariant noise br, plus some statistical noise e:
(Eq. 9) A = L + br + e
The time-derivative methods take the strategy of transforming the data into DA/Dt as an approximation of dA/dt, whereas the time-difference method would model DA with differences DL of the boundary model. In both, the idea is that the time-invariant component vanishes in the difference
(Eq. 10) DA = A1 - A2 = L1 - L2 + (br - br) + e + e = DL + 1.4e
The statistical noise is increased, and in both cases, we do not gain any information on the noise br.
In contrast, if we look at Eq. 2, it becomes clear that Sedfit applies the concept of a 'radial-average' scan and a 'radial-average' boundary model (i.e. at each radial value, average all scans and boundary models, respectively):
(Eq. 11) ![]()
(n denotes here the total number of scans). This average scan still contains the time-invariant noise br. It can be determined fairly precise if we have a large number of scans, because by averaging the statistical noise is reduced with a factor equal to the inverse square-root of the total number of scans.
Eq. 3 from above now tells us that we should model not pairwise differences of scans, but instead the difference between any particular scan and the average scan:
(Eq. 12) ![]()
With a large number of scans, this leaves the statistical noise virtually unchanged. (To be more precise, because Sedfit fits directly the raw data, the noise is actually not amplified at all, but additional degrees of freedom are introduced by considering the TI noise in the model.) Further, once we have determined the best-fit parameters of our model L, we can calculate directly the time-invariant noise as difference between the average data and the average boundary model:
(Eq. 13) ![]()
This gives us explicit values for br , which - if desired - we can subtract from the original data in order to better inspect the measured sedimentation process.
Although the systematic noise decomposition allows us to conveniently perform direct boundary modeling on interference data, and to obtain estimates of the time-invariant noise which we can subtract this from the data, there are two fundamental limitations that should be kept in mind:
First, the calculated systematic noise is only an estimate, which is model dependent (Eq. 2 and 13). For different models, the estimate will be different. Only if we have a pretty good fit of the sedimentation data can we assume the calculated noise to reflect the true baseline signal, as it might be measured, for example, in an experiment with a water blank. This is no problem, however, since, except in special cases (ref 5), the true baseline offset is not a meaningful quantity that we want to derive from our experiment. The important consequence of this, however, is that after subtracting our best-fit systematic noise estimate from the data, we should continue to allow for corrections to the systematic noise be made in the course of further modeling.
Second, as outlined above, there is no fundamental difference in the effect of systematic noise on the data analysis from a time-difference analysis. Because there is the unknown systematic radial-dependent baseline, the only source of information is the change of signal with time. In fact, as can be seen in Eq. 3 and 12, the parameters of the boundary model (L) are fitted to a time-difference of the data. In contrast to time-difference (or time-derivative) methods previously described, we do not take any particular scan as a reference for calculating the boundary movement in time, but we take the average scan as a reference, which is statistically advantageous. Nevertheless, by putting our equations in a form that is invariant with respect to adding the baseline parameters b, we have introduced the degrees of freedom in the analysis that make it equivalent to a time-difference method. These degrees of freedom can lead to correlation with (and leaving sometimes underdetermined) the sedimentation of small molecules. It is obvious, that this correlation will be worse for smaller data subsets. (For example, in a g*(s) analysis, there can be correlation with the low s-value part of the distribution, in particular with small data sets where the meniscus is not cleared [this is not as much a problem with other boundary models].)
It should be noted that this second limitation is separate from the actual estimation of the systematic noise b, as modeling of the sedimentation parameters with Eq. 12 precedes the calculation of the baseline parameters.
Fortunately, these issues are usually not problematic. In particular, if large data sets are used, the baseline is usually well-determined, and the correlation of the degrees of freedom with small s-values is low.
Example of the Noise Decomposition
The following example shows how interference optical data can be decomposed into the sedimentation part, the time-invariant noise, the radial-invariant noise, and the statistical noise:
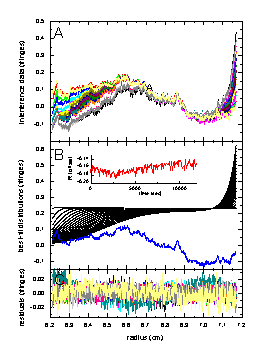
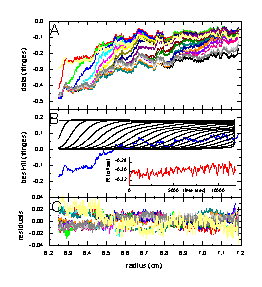
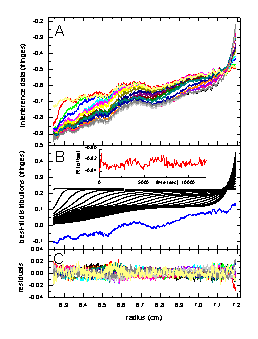
The left figure shows in the top panel (A) the raw sedimentation data from an experiment with myoglobin. Panel B below shows the results of fit with a single-component Lamm equation solution (black) considering RI noise (shown in red as a function of time), and TI noise (blue). The bottom Panel C shows the remaining statistical noise, which is nearly random and has an rms value of 0.0065 fringes. A similar decomposition is shown in the middle Figure for the fit of data from an IgG sample with monomeric and dimeric IgG modeled as a two-component Lamm-equation fit, with statistical noise of rms = 0.0072 fringes. In the right Figure is the result from modeling the mixture of the myoglobin and IgG sample with a 3 component Lamm equation solution (using the pre-determined values for s and M). Here, we get a decomposition with rms noise of 0.0051 fringes. More details on these examples are described in Ref. 1.
The noise parameters are well-determined, and interference optical data are well-described by the combination of TI noise, RI noise, and statistical noise. An example of how the systematic noise can be subtracted from the data can be found here.
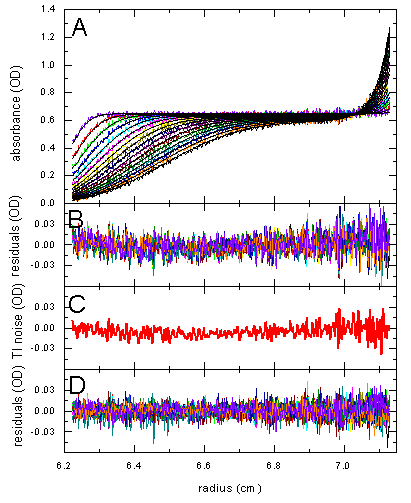
TI noise can also be useful when working with absorbance data. In Panel A below are sedimentation data of myoglobin, in Panel B the residuals of a single-species Lamm equation fit, which has an rms of 0.013. A close inspection of the noise in B reveals that it is not entirely random, but has some time-invariant features. If we model the data with TI noise (Panel C), we arrive at much more random residuals, with an rms value of 0.009.
More details can be found in Ref. 1.
More examples can be found in the step-by-step tutorial, which includes the treatment of systematic noise in interference data, as well as in the example of using Sedfit.
(1) P. Schuck and B. Demeler (1999) Direct sedimentation analysis of interference-optical data in analytical ultracentrifugation. Biophysical Journal 76:2288-2296.
(2) C.L. Lawson and R.J. Hanson. (1974) Solving Least Squares Problems. Prentice-Hall, Englewood Cliffs, New Jersey
(3) Ruhe, A., and P. Å. Wedin. (1980) Algorithms for separable nonlinear least squares problems. SIAM Review. 22:318-337.
(4) S.R. Kar, J.S. Kinsbury, M.S. Lewis, T.M. Laue, and P. Schuck (2000) Analysis of transport experiments using pseudo-absorbance data. Analytical Biochemistry 285:135-142.
(5) P. Schuck (1999) Sedimentation equilibrium analysis of interference optical data by systematic noise decomposition. Analytical Biochemistry 272:199-208.