[ sedfit help home ]
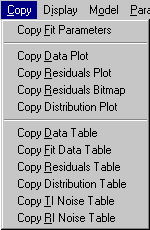
contains the commands for transferring data, plots, analysis results to the clipboard.
The general idea is that for documentation, storage, and printing, programs other than Sedfit should be used. In order to simplify data transfer, the copy menu can be used to place any relevant information to the clipboard. Next, another program, such as your favorite spreadsheet or plotting program (Origin, Sigmaplot, or other) or word processor, should be opened, an appropriate structure for data storage generated (a new worksheet, spreadsheet, document, slide, or plot layer), and the paste command used to place the data into this structure.
The advantage of this procedure is that the user does not need to get acquainted with new commands tasks such as documentation and creating publication quality figures, and that it simplifies the user-interface programming overhead in Sedfit.

Copy Data, Fit and Residuals Tables
Copy | Copy Fit Parameters
For rapid documentation when working with the discrete ideal species model,
the fit parameters can be copied into the Windows clipboard using this function.
After copying the parameters, switch to any word processing program under
Windows, and paste (control - V) this as text into a document.
This is the information copied:
component 1 included:
M = 65000.000000 g/Mol (floated)
s = 4.514 S
component 2 included:
M = 130000.000000 g/Mol (floated)
s = 6.510 S
component 3 included:
M = 200000.000000 g/Mol (floated)
s = 8.468 S
component 4 included:
M = 10000.000000 g/Mol (floated)
s = 2.005 S
concentrations = 3.018 | 0.107 | 0.000 | 0.447 | (first is total, next are fractions)
meniscus at 6.2299 cm (fixed)
bottom at 7.2206 cm (fixed)
baseline at 0.00000 OD (floated)
time independent baseline fitted
fitted from 6.2532 to 7.1550 cm
with constant initial distribution
simulation start time 0.000000 sec (fixed)
rmsd=0.003600 (n=11367,SSR=0.147278)
This command may be of limited use with other models.
Copy Graphics of Data and Residuals
Copy | Copy Data Plot
Copy | Copy Residuals Plot
Copy | Copy Distribution Plot
Any of the data graphics shown in Sedfit can be copied to a word processor or a slide (such as PowerPoint) as windows graphics metafiles. The presentation can be changed somewhat by connecting the data points with lines, and by using black and white graphics instead of colors, and for better results, the residuals or the data plot, respectively may be toggled off (see display commands).
The quality of these graphs is very limited, but publication quality can be generated with a conventional spreadsheet and plotting program.
Copy | Copy Residuals Bitmap
This function puts the residuals bitmap formed by the converting the residuals into a grayscale picture into the clipboard. This way, the picture can be pasted into any other windows program, such as Origin, or PowerPoint.
Copy | Copy Data Table
Copy | Copy Fit Data Table
Copy | Copy Residuals Table
Copy | Copy Distribution Table
Copy | Copy TI Noise Table
Copy | Copy RI Noise Table
In order to circumvent the limited plotting and printing capabilities of the current version of Sedfit, these menu functions each copy a matrix of numbers in ASCII text format to the clipboard. The data can then be pasted in principle into any spreadsheet program. In particular, it is compatible with pasting into worksheets of the Origin graphics program that comes with the centrifuge.
The format of the data, fit data, and residuals are slightly different for interference and absorbance. In interference data, all scans have the same radial grid. Therefore, the radial grid points will be the first column in the table, and all subsequent columns are only the fringe values at these radial positions. For absorbance data, the grid points are slightly different for each scan, and therefore the columns will be a sequence of pairwise (r,A) data. The order of the scans is in general the reverse of the loading order (i.e. the order of the marking the files when loading data in the file dialog box, except for the first and last scan).
! Please Note if Using Origin: For pasting absorbance data into Origin, a worksheet template that has multiple x columns with alternating x and y columns should be generated and loaded before pasting the data. For interference data, the default worksheet works fine. After pasting, the data can be easily plotted by marking the whole worksheet and using the menu function in Origin ‘plot’ and selecting the desired plot type. This avoids handling each scan separately.