[ sedfit help home ]
Sedfit has a few functions for statistical analysis of the results from modeling the data.
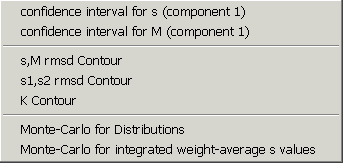
Besides the Runs Test, which is calculated for every fit, Sedfit has functions for calculating confidence intervals for sedimentation coefficients and molar mass values. This is done by the method of constraining the parameter of interest to sub-optimal values, fitting for all other parameters, and monitoring the increase of the rms error of the fit. The cut-off increase is calculated using F-statistics. While this is process is automated for s and M in the non-interacting discrete species model, only partially automated functions are available for mapping two-dimensional error contours of monomer-dimer self-association models.
For more complex problems or confidence levels for parameters in other models, they can be calculated by moving the parameter of interest manually to sequentially less optimal values, until the cutoff value of the rmsd increase is reached (which can be obtained from the F-statistics calculator function). This strategy is explained in detail by Johnson & Straume (ref1).
A different way for analyzing the statistical properties of the results is recommended for the size-distribution analyses, which is Monte-Carlo simulations.

related topics: F-statistics, Runs Test
References:
(1) M.L. Johnson and M. Straume (1994). Comments on the analysis of sedimentation equilibrium experiments. In: Modern Analytical Ultracentrifugation (Schuster TM and Laue TM, eds) Birkhauser, Boston, p.37-65