For carrying out sedimentation equilibrium experiments in significantly shortened time, see the TOSE video tutorials at https://sedfitsedphat.nibib.nih.gov/tools/Protocols/Forms/AllItems.aspx
SedphaT has several levels of sedimentation equilibrium support. They are all based on loading the raw scan data into the experiment structures for a single "Sedimentation Equilibrium" xp-file and "Multi-Speed Equilibrium" xp-files.
In order to generate these xp-files, it may be convenient to use Sedfit as a tool to automatically generate the xp-files from a sequence of scan files (if you use the scan mode for 'equilibrium method' on the ultracentrifuge). Relevant Sedfit tools include: Loading Options-->Save Intensity as Absorbance, and Loading Options-->Sort Eq Data. For working with data from 6-channel centerpieces, separate the individual channels using the Loading Options-->Save 6-channel Raw Data in 3 Subsets function (for more information on 6-channel data see here).
Dealing with 6-channel data is no problem, just use the function Loading Options-->Save 6-channel Raw Data in 3 Subsets prior to any other. [There is an old powerpoint presentation that illustrates how to assemble data directly into xp-files in Sedphat, but this has become obsolete from version Sedfit9.4 which allows carrying through the 6-channel data to all other data sorting functions in Sedfit.]
Models that can be used are those for non-interacting species, for example, in the hybrid discrete/continuous model, or any of the interacting species models (self-association, hetero-association, mixed associations, and ternary systems). For the interacting models, incompetent fractions can be accounted for. Additionally one non-participating species can be described (for example, from a known impurity of molar mass different from all the species of interest).
If experiments are combined where the solvent density is significantly different, it is possible to fit for vbar of the macromolecule. For protein-detergent systems, the vbar of the free detergent micelle can be fitted separately (if the detergent micelle is treated as the non-participating species), thus eliminating the need for a complete density match and simultaneously solving for vbar of detergent and protein/detergent complex.
Typically, fitting models for interacting systems to sedimentation equilibrium data is done with 10 - 20 experimental scans. In this situation, the error surface can be very complicated, and it can be difficult to verify that the fit has converged in the global minimum. There will be many local minima. Therefore, it is highly advisable to take advantage of all different fitting methods (in particular, simulated annealing and Marquardt-Levenberg, see the page on Fit information).
It is also very important, and in many cases essential for getting a well-defined answer, that mass conservation models be used. This can be done most conveniently in the form of multi-speed sedimentation equilibrium experiments, where the same cell is attaining sedimentation equilibrium at different speeds. When using mass conservation, it is usually advisable to treat the bottom of the solution column as a floating parameter, as described in
J. Vistica, J. Dam, A. Balbo, E. Yikilmaz, R.A. Mariuzza, T.A. Rouault, P. Schuck (2004) Sedimentation equilibrium analysis of protein interactions with global implicit mass conservation constraints and systematic noise decomposition. Analytical Biochemistry 326:234-256 (preprint)
Finally, it is very advantageous to scan at several wavelengths and sometimes in combination of interference optics and absorbance optics. Having several signals can greatly improve the ability to distinguish species and to obtain a large dynamic range of concentrations.
There is a complete step-by-step tutorial for a protein-DNA interaction.
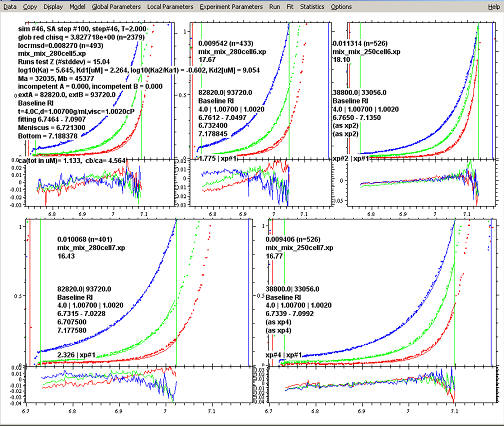
A screenshot from a typical sedimentation equilibrium analysis is this: